
Context Aware Recommendation with Vector Databases
In this post I explore an emerging type
of recommendation system focused on the context rather than the traditional
similarity based methods. This post is inspired by my past work on a user-to-user pairing system
that similar to user-to-item recommendations. I explained how to extract the meanings out of the
unstructured data and store it on a representative vector. These vectors are then stored in a vector
database, enabling the identification of similar contexts. Finally I provide an example use case,
demonstrating the code for implementing these systems. While I cover the basics, dealing with
real-world data requires more complex and scalable systems with low latency requirements.
The Recommendation
Problem
Recommendation systems aim to understand what users want, which
can be challenging with limited interactions. By linking behaviors to available options we can
better predict what might interest them. I like to think of a recommendation system as a function
that takes in user information and outputs a list of top items they might like. This is not confined
to recommending a product to a user, for example a user-to-user pairing in chess tournaments or
profile ranking in dating apps are also considered recommendation in essence. In its most common
formulation, the recommendation problem is reduced to problem of estimating ratings for the items
that have not been seen by a user. While it's tricky to guess exactly what a user wants,
getting it right can benefit a business. In fact, a smart recommendation system can increase sales
by about 22.66% on average!

Many recommendation algorithms rely on similarity
being either user similarity or item similarity. However these two recommendation types require a
deep understanding of both user/item data and scenario to establish connections between them.
Let's delve into a hypothetical scenario where an online library wants to design an academic
paper recommendation system for its users. Common approaches would be:
- content-based
filtering, similar items that users interacted with previously
and/or
-
collaborative filtering, items that similar users engaged with

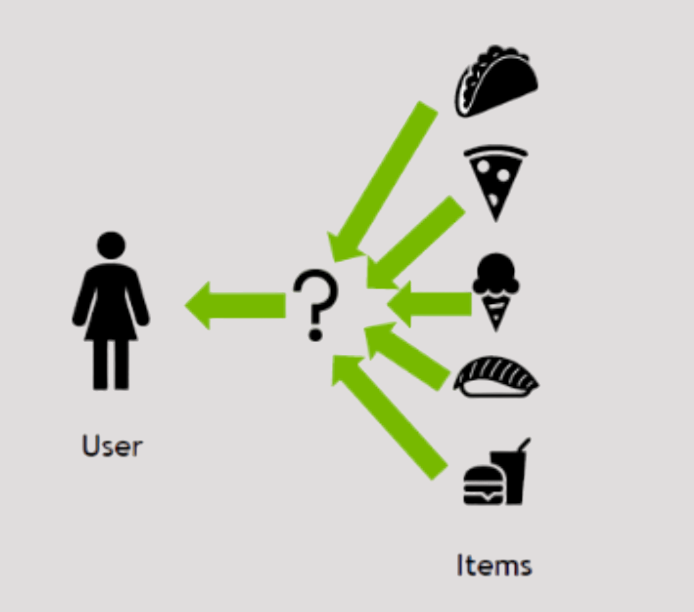
Figure: User similarity (collaborative filtering) and item
similarity (content-based filtering)
Context Aware Recommendation
Systems
While similarity based approaches are widely adopted they require a
decent amount of data to establish statistically significant patterns. Unfortunately in most
business cases, they fail to perform well because the interaction data is limited.
The similarity patterns between users or items can lead to ambiguity and retrieve unsuitable
recommendations. Additionally the cold start problem poses a challenge, particularly for new users
with no prior interactions. In such cases, similarity-based recommendation systems may only offer
default suggestions.
To address these issues, context aware recommendation
systems offer a promising alternative by considering contextual information of the
user/item/interaction. Contextual information can be inquired directly from the user/item or
indirectly by generating representative query as metadata. This creates the context we need from the
path and relevance searching will be carried out by this context for these systems.
" I assume as the LLMs take over, creating metadata like a query
will be more prevalent and accurate "
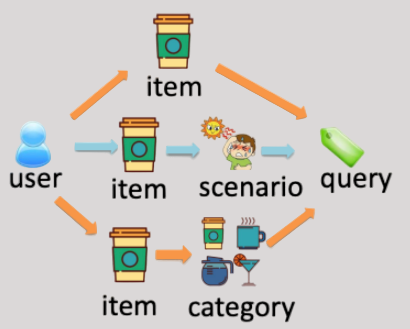
Figure: A query can be generated from
different context aspects like item's name/category, interaction's setting and
scenario
A traditional approach for context based recommendations could be
using full-text search for query. This approach will be inefficient because in real life the texts
are not exactly the same, although they might carry similar meaning. Strings are lexical references
but what we look for is the semantics (=meanings).
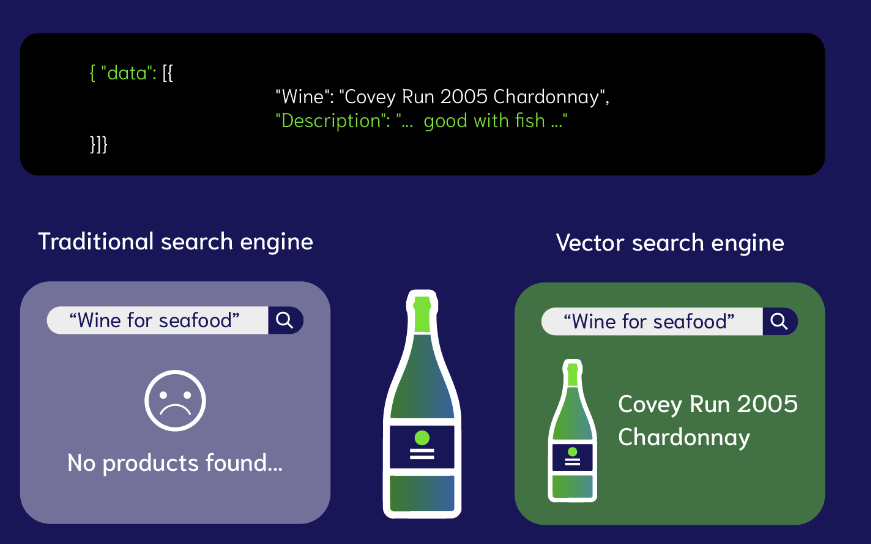
Figure: An example from Weaviate for
full text search does not retrieve desired results. Altough fish and seafood are semantically
close, the algorithm could not retrieve relevant item in full-text search.
Extracting the Meaning out of Text
In
order to work on semantics we need to capture the meaning of a word. The state-of-art way of
capturing meaning is to represent the text in an array of numbers, we call this data structure an
embedding. It is a vector that represent features of data extracted from the
source. Great thing about embeddings is the input data is not restricted to text, images and audio
can also be transformed into embeddings.
Transforming data from any kind to embeddings is
called vectorization. Vectorization outputs similar arrays when given similar
inputs and we can calculate how similar those arrays are for estimating the semantic relation of
these inputs. For example cat and kitten are two close words with similar features but totally
different in text similarity. The embeddings look like:
cat = [1.5, -0.4, 7.2, 19.6,
3.1, ..., 20.2]
kitty = [1.5, -0.4, 7.2, 19.5, 3.2, ..., 20.8]
These
values in the embedding vectors do not represent a specific feature a human can grasp. Since
vectorization is a deep learning method it is almost impossible to explain what those numbers
represent in the total meaning of the word. However, some calculations with the vectors might give
us an intuition about the meanings, a great example is given by Jay Alammar illustrates if we
subtract man from king and add woman, we get a result that is way more similar to queen than any
other word in the corpus.

Figure: An example of feature
representation guessing from basic calculations with the embedding vectors.
Modern embeddings are created by deep learning models and they are
context aware. Each occurrence of a word has different embeddings modified by
surrounding text. For example light in the "bright light" and "light weight
dumbell" are not the same. In the last couple of years we’ve also seen multimodal embedding
models, like CLIP, enable algorithms to link an image to a text representation. This is the core of
text-to-image algorithms.
Implementing Recommendation System with Vector
Database
For recommendation, we need to find semantically similar items
with the given query. First we need to have a corpus of item embeddings, then vectorize the query
with the same method and find the most similar items with the query. Finding similar items with the
query at this point is just a vector operation of calculating the distance and taking the nearest
neighbours of the query vector.
We need a database to store our item’s embeddings and a
database management system to search for a relevant item with CRUD capabilities. Vector databases
are a special type of database that specialize in storing and searching vector data structures. The
operation is simple, first create embeddings of our items and store them in a vector database.

Figure: Query is vectorized by the same
embedding model item data is vectorized. Vector Databases are specialized to retrieve the similar
vectors
Vector databases create an index for the vectors for storing. This
allows for fast lookup when querying. The vectors in any index we are creating must share the same
dimensionality and distance metric for measuring similarity. To judge how similar two vectors are we use
distance metrics. The lower the distance metric between the user query and the item is, the more similar
the two. It's essential to choose a distance metric that aligns with the specific model you're
using. For example, if you're using a Siamese Neural Network (SNN) for embedding, the contrastive
loss function typically incorporates the Euclidean distance. Similarly, when fine-tuning a sentence
transformer, you define the loss function, where the CosineSimilarityLoss computed similarity based on
cosine similarity between two embeddings. In essence, there isn't a universal distance metric that
fits all scenarios. The choice depends on various factors such as your data characteristics, the model
architecture, and the intended application. While cosine distance and dot product may yield similar
results in some cases. Similarly, the Manhattan and Euclidean distances trade off between accuracy and
speed, making them suitable for different contexts.

Example with Code
Let’s say we’re
building a recommendation system for academic papers. The papers have summary part where we can
extract meaningful insights of its context. So instead of user/paper similarity on past interaction
data, the assumption is that the summary holds more information on what's the paper about. A
vector database of summary embeddings will be populated. Then when a user search a query or the
application generates a query from the interactions, will be feed into the database to retrieve most
similar items. Those items will be the recommended papers to the user. Let's run over a sample
code to achieve this!
1- Import all neccesary modules and define database's index
and embedding model. sentence-transformers library provides pre-trained embedding models. I chose
all-MiniLM-L6-v2 because it’s light and fast but still does not underperform.
import arxiv
import pandas as pd
from sentence_transformers import SentenceTransformer
from pinecone import Pinecone
from collections import defaultdict
from tqdm import tqdm
import time


pc = Pinecone(api_key=pc_api)  # your VDB api key
model = SentenceTransformer('all-MiniLM-L6-v2')  # embedding model
index_name = "papers"  # name of our index
2- Define embedding function and create the index in the
database. For this task I used Pinecone as database. Pinecone is easy to use and it offers $100 free
usage when first signing up. For a small throughput, it should be enough for a long time.
def embed_func(text):
    return model.encode(text).tolist()  # returns the embedding vector

pc.create_index(
name="papers",
dimension=384,     # dimension of the embedding model vector size
metric="euclidean",  # choose the distance metric according to the use-case
spec=ServerlessSpec(
    cloud='aws',
    region='us-west-2' )
)

index = pc.Index("papers")
time.sleep(1)
index.describe_index_stats()  # get the VDB's index properties
3- Define the functions that populates the index by pulling the
data and vectorize it and search the index with database's internal functon. Pinecone also
allows inserting metadata with the item so we can do a hybrid search with the other features like
author.
def get_arxiv_df(embed_func, length=100):
    results = arxiv.Search(
        query="cat:cs.AI OR cat:cs.CV OR cat:stat.ML",
        max_results=length,
        sort_by=arxiv.SortCriterion.Relevance,
        sort_order=arxiv.SortOrder.Descending,
    ).results()
    df = defaultdict(list)
    for result in tqdm(results, total=length):
        try:
            df["title"].append(result.title)
            df["summary"].append(result.summary)
            df["authors"].append(str(result.authors))
            df['updated'].append(result.updated)
            df["url"].append(result.entry_id)
            df["vector"].append(embed_func(result.summary)) #create the embedding vector

        except Exception as e:
            print("error: ", e)

    return pd.DataFrame(df)

def search_table(query, embed_func=embed_func, lim=3):  # retrieve top 3 similar items
    db = pc.Index("papers")
    embs = embed_func(query)
    results = db.query(vector=embs, top_k=lim, namespace="papers")  # search the VDB
    return results["matches"]
4- Now we can play around with this application by changing the
query
if __name__ == "__main__":
    df = get_arxiv_df(embed_func, length=100)
    embed_into_pinecone(df)
    query = 'self supervised learning'
    results = search_table(query, embed_func=embed_func, lim=3)
    print(results)
Closing Notes
In this post I
tried to explain context aware recommendation systems and its implementation using vector databases.
We're still figuring out the use cases of AI and it's absolutely more than chatbots. We
can understand our users better or extract meaning out of different kinds of data. I believe future
recommendations will be more personalized and context aware.
I realized the success of
AI implementation in businesses depends heavily on the data management. The key challenges are
making sure accurate/clean data is fed into these algorithms, fast accessibility, effective cost
management for storage, and proper integrations.
If you're a business interested in
collaborating or an individual with feedback on the post, please contact me. Thank you for
reading!